New Customer? Register for an online shopping account.
Are you a current McCrometer Factory Representative and need access to the Partnership Portal?
White Paper | October 14, 2022
Download as a PDF document
Presented at ASME Fluids Engineering Conference 1993, Washington, D.C.
 Installation effects of upstream disturbances on flowmeters are important in today’s marketplace. Lengthy upstream piping required by many types of flowmeters can substantially increase the cost of flowmeter installations. This is especially true when flow meters are added to existing systems. Obviously, interest is building about the effects of common installation problems. One common disturbance found in piping configurations is the single 90° elbow and close coupled double 90° elbow out-of-plane. The National Institute of Standards and Technology (N.I.S.T.) in Gaithersburg, Maryland is studying installation effects on several flowmeter technologies as part of a government/industry consortium.
The McCrometer Division of Ketema Inc. is conducting installation effects tests on the V-Cone flowmeter at the McCrometer water test laboratory in Hemet, California. Since 1986, McCrometer has replicated the N.I.S.T. tests performed on a typical orifice plate flowmeter. Both N.I.S.T. and McCrometer tests incorporated a wide range of beta ratios from 0.363 to 0.750 and used relative positions of the meter to the elbows from 0 to 190 diameters. McCrometer tests indicate that the V-Cone is less susceptible to the presence of upstream single elbows and double elbows out-of-plane than a typical orifice plate flowmeter. Depending on beta ratio and the type of elbow upstream, it appears an orifice meter can require as much as fifty diameters of upstream pipe run. McCrometer’s tests indicate that within the tested beta ratio range, the V-Cone meter can be installed close — even close coupled — to either single or double elbows out-of-plane without affecting the stated accuracy of the meter more than 0.3%.
Recently, much interest has been focused on the effect of different installations on flowmeter accuracy. More people are becoming aware that a flowmeter primary element is only part of the entire flow measurement system. The accuracy of the measurement system depends as much on the primary element of the flowmeter as the secondary instrumentation and the upstream and downstream pipe runs adjacent to the flow meter.
Each flowmeter technology requires a certain distance of straight, undisturbed pipe before and after the primary element. Depending on the flowmeter requirements, these distances are often difficult or impossible to achieve. For instance, a flowmeter may require more piping than is available in an existing system where flow measurement was not necessary before. A new application may have limited area, such as on oil platforms or vehicles. Perhaps the distance is available but the cost of providing straight pipe before and after the primary element is limiting. In systems with 25 mm line sizes, installation requirements may only require a meter or two. This cost may not be significant. However, in systems where line sizes reach over 700 mm, the cost of providing 35 D of straight run before a meter may be prohibitive.
The design engineer can usually compromise in some way to accommodate the limitations of the flowmeter. However accuracy or permanent pressure loss sacrifices. Accuracy decreases if the piping requirements are ignored. Permanent pressure loss increases if a flow conditioner is employed upstream of the meter. Either solution is less than ideal.
With these problems in mind, the National Institute of Standards and Technology (N.I.S.T.) in Gaithersburg, Maryland, decided to form a consortium consisting of sponsor members from industry and other government programs, both domestic and foreign. N.I.S.T. thus began the “Industry-Government Consortium Research Program on Flowmeter Installation Effects.” The goal of this group was to study the flow patterns of water after common installation problems such as single elbows, double elbows out-of-plane, tees, and reducers. N.I.S.T. then installed flowmeters after these disturbances. Industry members donated two flowmeters to represent a typical differential pressure orifice plate flowmeter and a typical turbine flowmeter. Characteristic curves were plotted to show the flowmeter’s variance at different positions relative to the elbows or other disturbances. This might allow end users of orifice plates or turbine meters to characterize their meter’s performance according to the installation.
One hope of the consortium was that industry members with proprietary meters would run tests parallel to the tests run at N.I.S.T. The McCrometer Division of Ketema, a flowmeter manufacturer and consortium member, in Hemet, California decided to run installation effects tests on the V-Cone differential pressure flowmeter. This is a patented design, differential pressure producing device using the same basic principles of flow measurement as the orifice plate. The overall goal of these tests was to define installation requirements for the V-Cone downstream of common disturbances. McCrometer converted an existing test lab to emulate N.I.S.T. test conditions. Configurations tested to date have been the single 900 elbow and the double 900 elbows out-of-plane.
McCrometer introduced the V-Cone flowmeter in 1986 as an alternative to traditional differential pressure flowmeters. The goal in the development of this device was to create a meter that emphasized the advantages, but overcame the limitations, associated with traditional differential pressure flowmeters.
McCrometer holds patents on the V-Cone in the United States and several European countries. The geometry of the V-Cone suggests a radically different approach to differential pressure flowmetering, see Figure 1.
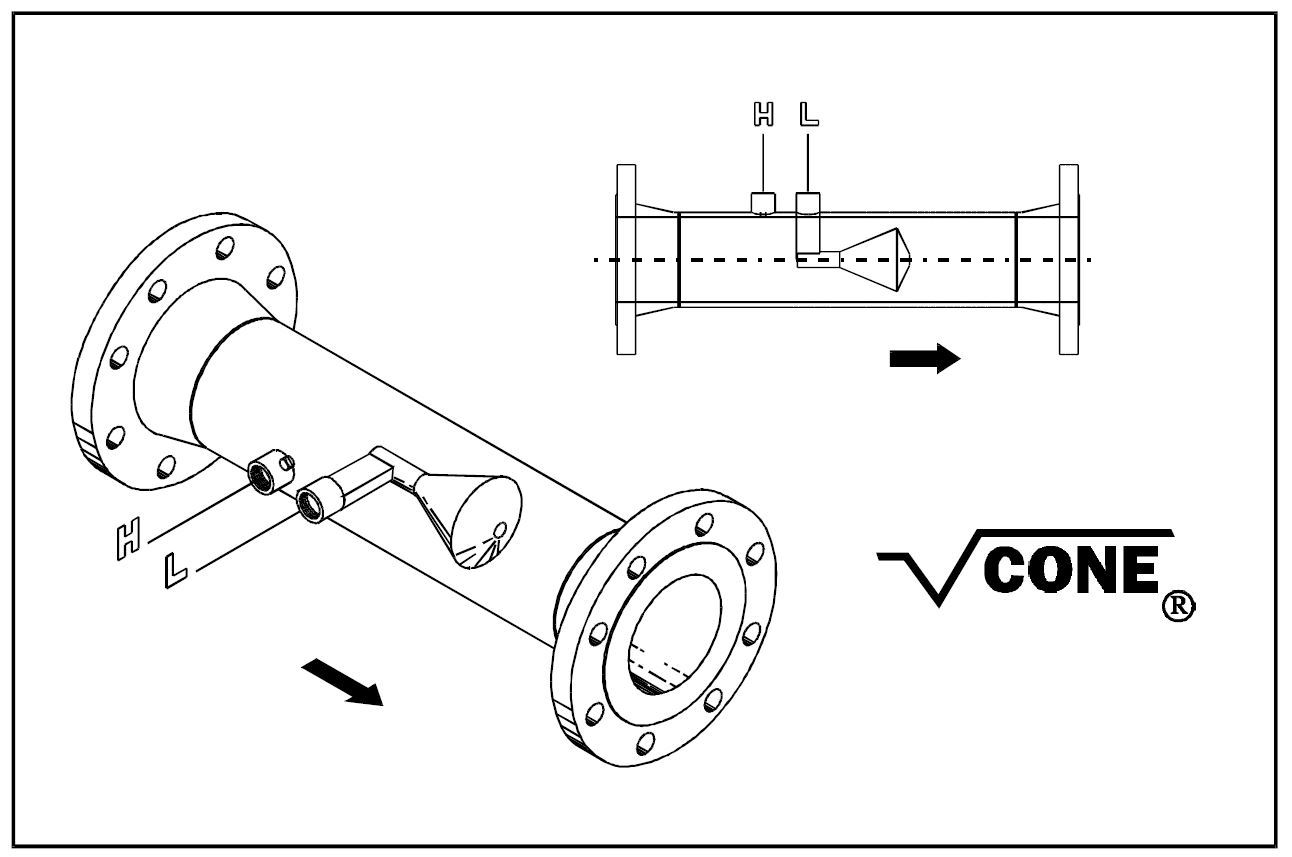
As with other differential pressure devices, the flow constricts to create high and low velocity areas, which creates a differential pressure signal. However, the V-Cone’s constriction is not a concentric opening through the center of the pipe. The V-Cone creates an annular opening, forcing the fluid to flow around a cone suspended in the center of the pipe.
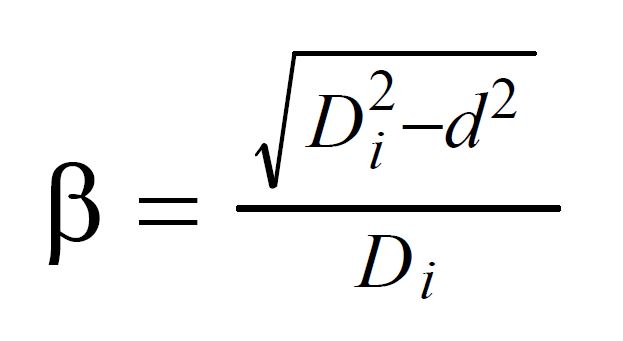
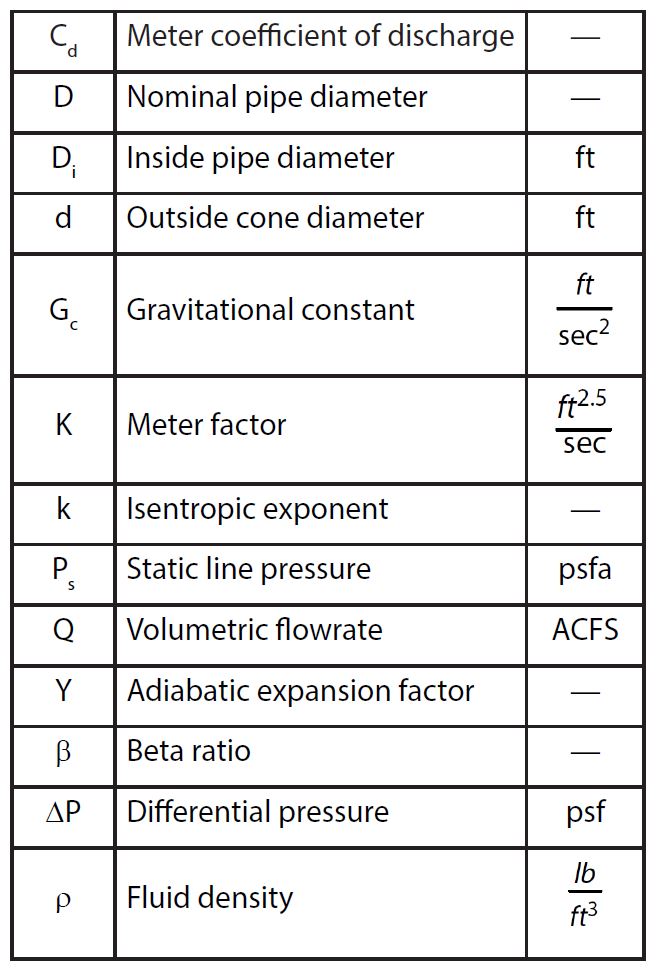
Equations for the V-Cone are slightly different from an orifice plate or venturi. The beta ratio, b, is the ratio between the square root of the open area in the pipe and the square root of the open area at the meter’s constriction. The V-Cone’s beta ratio is shown above.
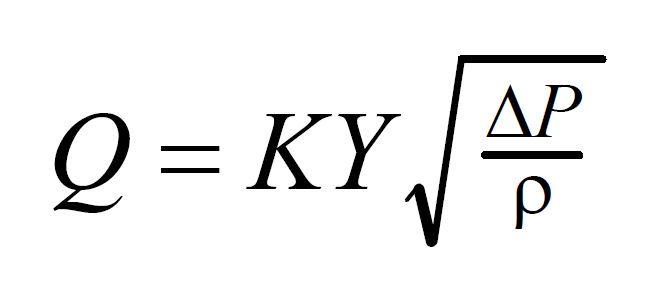
The standard equation for differential pressure flowmeters is shown above.
The k factor for the V-Cone is shown above.
For compressible flow, McCrometer applies the standard equation for the adiabatic expansion factor, Y:
Note: The adiabatic expansion factor applied only if Y>0.96. Otherwise a characteristic expansion factor must be derived for the meter based on calibration data in a compressible fluid.
The test parameters for the V-Cone tests were set to follow the test parameters established by N.I.S.T. tests on the orifice plate.
The McCrometer static gravimetric flow calibration stand can test 12 mm to 100 mm nominal diameter flowmeters.
Figure 2 shows a schematic diagram of the testing apparatus. Figure 3 shows a scaled diagram of the test section.
The closed system recirculates water constantly from a 2200 liter storage tank. An electric pump draws the flow from the tank through a 100 mm PVC pipe. From the pump, the water enters an upstream header. The 250 mm by 1200 mm chamber incorporates straightening vanes and a dampening screen to lessen pulsations from the pump. A recirculating by-pass line of 50 mm PVC pipe also helps to reduce pulsations. The water leaves the header horizontally through a 50 mm PVC ball valve, used to ease startup vibrations.
The water passes through 50 D of straight 50 mm PVC pipe before entering the single elbow or the double elbows out-of-plane. The elbows are all 900 long radius (centerline curvature=1.5 D.) Flow then passes through the 200 D of horizontal test section. Test section piping is schedule 40, stainless steel with an approximate wall roughness of 3mm. After passing the test section, the water turns vertical, passing a PVC ball valve. This valve is used for flow regulation purposes. The diverter section follows.
A pneumatic system diverts the water to either a receiving tank, open directly to the storage tank, or to a collection tank. The collection tank weighs the collected water over a measured time. An optical sensor on the diverter triggers a timer to measure the precise time of the collection period. A mercury thermometer measures the fluid temperature.
In the test section, the meter was leveled prior to testing. Differential pressure taps on the meter face the “inside” of the elbows. A “smart” differential pressure transmitter measured the differential pressure created by the meter. The 4 to 20 mA signal from the transmitter was measured with a multimeter. A computer collected 200 data points over the test period through an IEEE-488 bus.
Prior to testing, the transmitter was calibrated using a pneumatic dead weight tester. The “smart” capability of the transmitter allowed the full scale differential pressure of the transmitter to be scaled to the full scale created by each meter at the desired maximum flowrate.
The objective of the first set of McCrometer tests was to detect the effect of upstream elbows, both a single 900 elbow and double 900 elbows out-of-plane, on a V-Cone meter. The double elbows were close coupled.
Accuracy for the V-Cone primary element is ±0.5%. During the evaluation, a deviation outside of ±0.5% was considered to be an effect of the elbow configuration. The McCrometer tests included three 50 mm V-Cone flowmeters with beta ratios of 0.363, 0.650, and 0.750. beta ratios for VCones represent the same area ratio that standard orifice plate beta ratios represent. These meters represent the typical range of beta ratios for V-Cone applications. End connections were standard ANSI flanges (150 pound, raised face, slip-on.) The test fluid was water at approximately 200C.
Test conditions were to include the following flowrates:
| V-Cone meter | Flowrate range | Re range |
|---|---|---|
| b= 0.363 | b= 0.363 | 11,000 to 65,000 |
| b= 0.650 | 8 to 31 gpm | 14,000 to 51,000 |
| b= 0.750 | 15 to 65 gpm | 25,000 to 110,000 |
The meter was first placed a maximum distance from the elbows. The data taken at this point was the baseline data for the particular meter. In this position the meter was 190 D away from the elbows. Each meter was then moved in intervals closer to the elbows. Six different positions relative to the elbows were tested. The positions were approximately 190, 23, 9, 2, and 0 D away from the elbows.
At each position, each meter was tested at five flowrates covering the range stated above. At each flowrate a repeat point was taken for verification. Thus for each position, a total of ten test points were taken. These ten points were then averaged and plotted on Figure 4 and Figure 5.
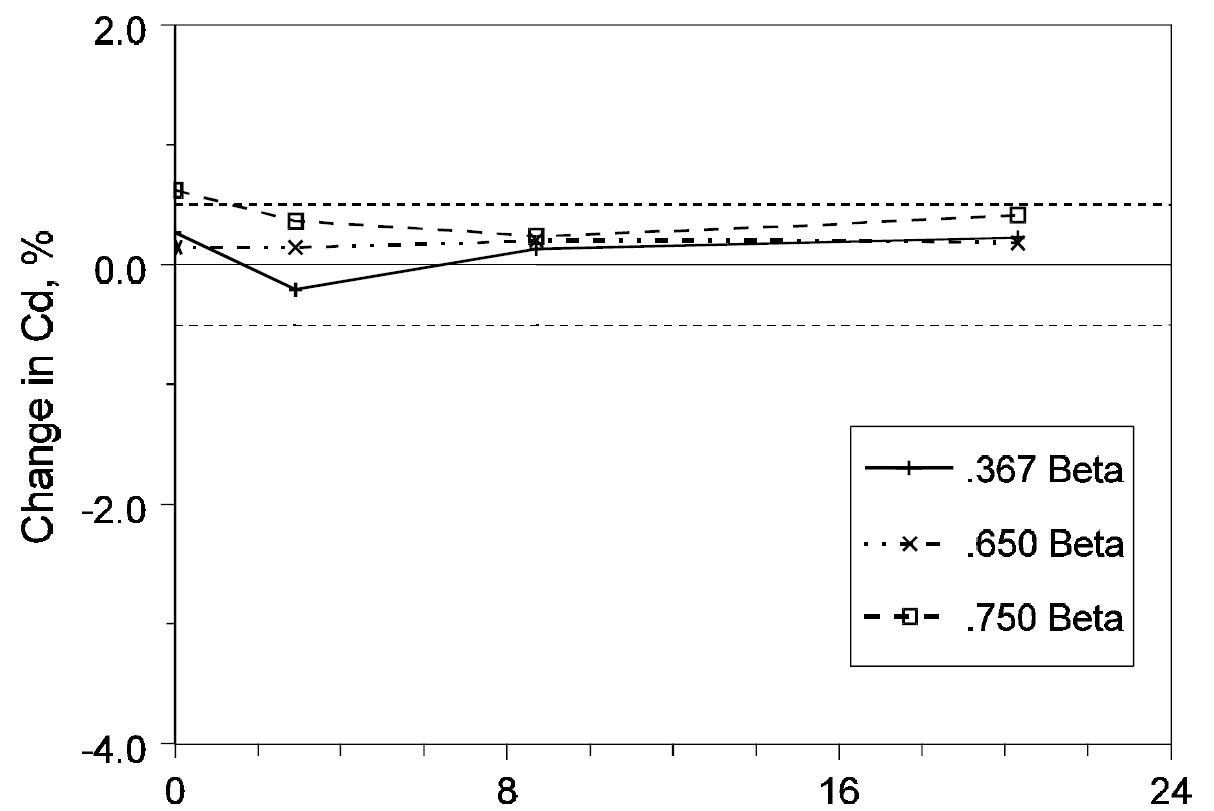
Figure 4 shows the change in the meter’s coefficient of discharge, Cd versus the distance of the meter from the single elbow in nominal pipe diameters. The change in the meter’s Cd represents the percentage deviation from the baseline data taken at 190 D. These points represent an average Cd of the Reynolds number range.
Two dashed error bars show the stated accuracy of the meter. These bars are at ±0.5%. Points outside these bars are considered results of the elbow upstream. On Figure 4, the V-Cone with b=0.750 showed a deviation at 0 D of +0.622% from the baseline data. All other points fell within the ±0.5% of the meter. The maximum effect of the single 900 elbow on the three V-Cones during the McCrometer testing was +0.122%. This was the largest deviation from baseline data with the V-Cone.
Figure 5 uses slightly different X and Y scales to show the effect of double elbows out-of-plane on the V-Cone. Only one point falls outside the accuracy bars. This point is at 100 D with the V-Cone at b= 0.650. The deviation was +0.504%. The maximum effect of the double 900 elbows out-of-plane on the three VCones during the McCrometer testing was +0.004%.

SIREP in England performed an evaluation of installation effects on the V-Cone. SIREP is an international instrument users’ association. The international industry members of SIREP approached McCrometer with the offer to evaluate the V-Cone according to the specifications of the meter. SIRA is the instrument testing branch of SIREP and was responsible for the evaluation process. Installation effects tests were among the variety of tests SIRA was to perform.
SIRA tested both the single 900 elbows and double 900 elbows out-of-plane before the V-Cone. The double elbows were close coupled. SIRA was to test the single elbow in two configurations, once with the taps in the same plane as the elbow, another with the taps perpendicular to the plane of the elbow.
McCrometer provided a standard 50 mm V-Cone for the tests. End connections were standard ANSI flanges (150 pound, raised face, slip-on.) The test fluid was kerosene at 30 0C (density = 801.4 kg/m3, viscosity = 1.73 cSt.)
The flow criteria for these tests were to be as follows:
| V-Cone meter | Flowrate range | Re range |
|---|---|---|
| b= 0.600 | 57 to 540 gpm | 13,000 to 125,000 |
The meter was placed at two positions relative to the elbow configurations, at 2 and 10 D downstream. Baseline data was taken from a straight line test with no elbows. At each position, the meter was tested at five flowrates. Three points were taken at each point.
SIRA results concur with McCrometer results on both the single and double elbow tests. On request, McCrometer will provide a copy of the SIREP evaluation report E 1705 S 92.
N.I.S.T. Results With A Typical Orifice Plate Flowmeter
Dr. George Mattingly and Dr. T.T. Yeh of the Fluid Flow group of the N.I.S.T. in Gaithersburg, Maryland performed installation effects on a typical orifice plate flowmeter. This was part of a government-industry consortium to study such effects.
Both a single 900 elbow and double 900 elbows out-of-plane were tested. The double elbows were close coupled.
The N.I.S.T. tests included three orifice plates in a 50 mm line. The stated accuracy of the meters was taken to be ±0.5%. The beta ratios tested were 0.363, 0.500, and 0.750. Flange connections were weld-neck ANSI flanges. The test fluid was water. Flow criteria for these tests were the same as the McCrometer tests.
The positions of the orifice plate to the elbows were similar to the McCrometer tests.
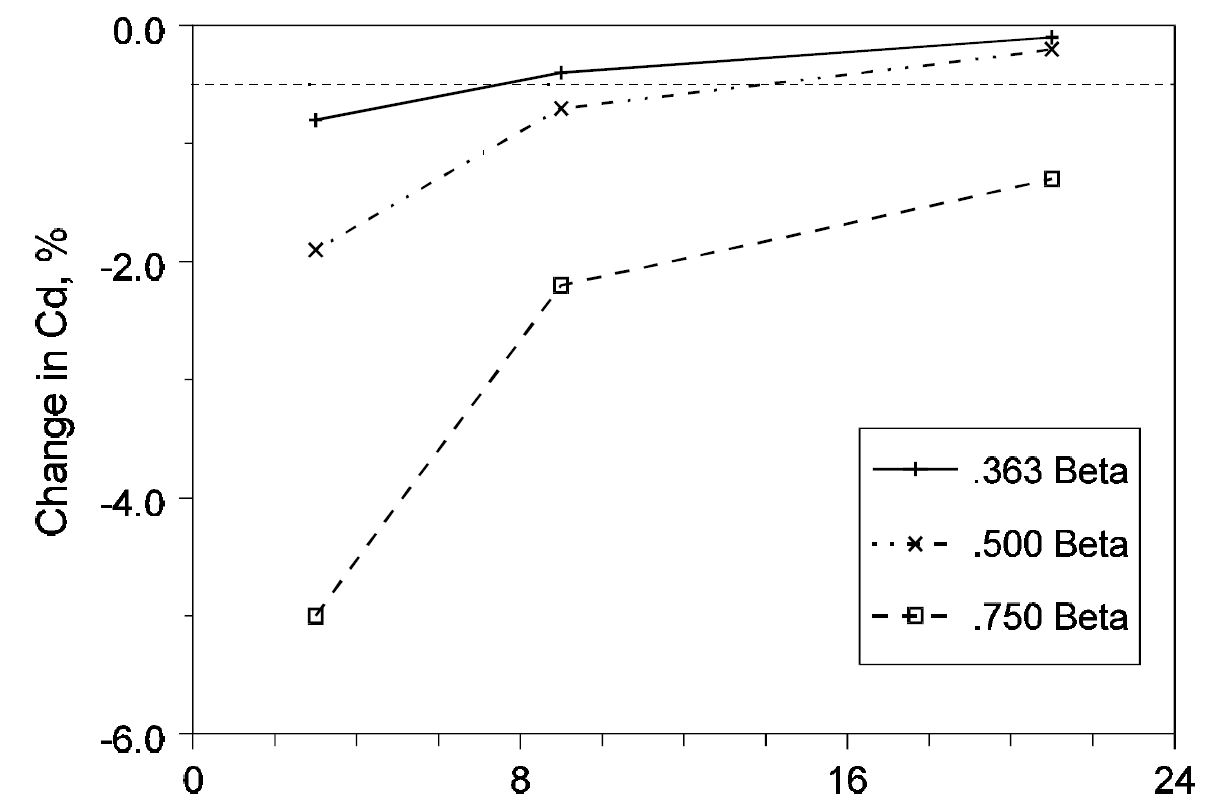
Figure 6 shows the effects of the single elbow on a typical orifice plate. The scales for the X and Y axis match those of Figure 4, single elbow effects on the V-Cone. The orifice plate showed significant effects from the single elbow. The maximum effect of the elbow (at 3 D with b= .750) was approximately -4.5%.
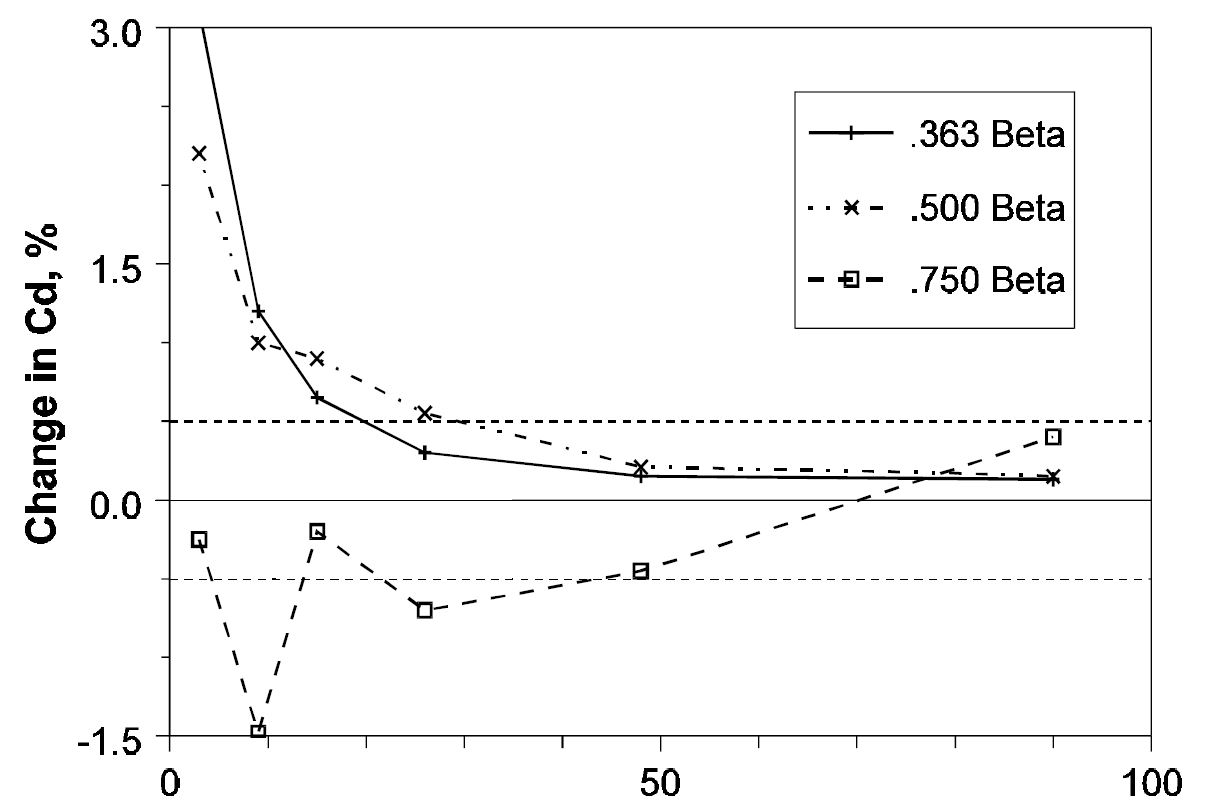
Figure 7 shows double elbow effects on the orifice plate. Again, the scales of Figure 7 match those of Figure 5, double elbow effects on the V-Cone. The orifice plate showed slightly less effect from the double elbows than the single elbow. The maximum effect of the elbows (at 3 D with b= 0.363) was approximately +2.6%.
In matching piping configurations and Reynolds number ranges, the V-Cone demonstrated less susceptibility to elbows upstream than a typical orifice plate flow meter.
V-Cones showed some effect from the elbows, up to 0.122% in one test. Orifice plates, however, showed extreme effects. This was not unexpected according to existing international orifice metering standards, both ISO-5167 and ANSI/API-2530. With a beta ratio = 0.750 orifice plate, ISO-5167 recommends 70 D upstream for double elbows out-of-plane. ANSI/API-2530 recommends 35 D for the same installation.
McCrometer’s goal was to identify installation requirements for the V-Cone. These first tests were not conclusive for those purposes. These tests do quantify the effects of elbows upstream of the V-Cone. For any V-Cone with a beta ratio between 0.363 and 0.750, the maximum effect of either a single elbow or double elbows out-of-plane would be approximately 0.12%.
More research is necessary to describe the V-Cone’s total performance. The geometry of the meter does not easily lend itself to comparison with other meters. Past studies have noted the flow pattern through a V-Cone primary element. Fluid traveling in the center of the pipe is forced by the cone to the wall of the pipe and through the annular constriction. This mixing of the low and high velocity areas of the flow creates a pronounced “flattening” of the flow profile directly upstream of the meter. This characteristic of the V-Cone is the most probable cause of the V-Cone’s consistent performance in less than ideal flow situations.
MILLER, R. W. - Flow Measurement Engineering Handbook, Second Edition, McGraw Hill, New York, 1989.
MATTINGLY, G. E. and YEH, T. T. - “Effects of pipe elbows and tube bundles on selected types of flowmeters.” Flow Measurement and Instrumentation, Vol. 2, Number 1, p. 4, 1991.
MATTINGLY, G. E. and YEH, T. T. - “Summary Report of NIST’s Industry-Government Consortium Research Program on Flowmeter Installation Effects with Emphasis on the Research Period November 1988 to May 1989.” U.S. Department of Commerce, NISTIR 4310, 1989.
MATTINGLY, G. E. and YEH, T. T. - “Summary Report of NIST’s Industry-Government Consortium Research Program on Flowmeter Installation Effects with Emphasis on the Research Period May 1989 to February 1990: Tube Bundle Effects.” U.S. Department of Commerce, NISTIR 4751, 1990.
BAGGE, D. J. - “Evaluation of Ketema, V-Cone Flowmeters.” Test Report E 1705 S 92, SIREP, 1992.